The Mindful Landlord’s free Baltimore rental property ROI calculator is live — and it’s built on real data from 50+ properties we manage across Baltimore City and County. Plug in any property, get your annual cash flow, cash-on-cash return, and 5-year equity curve in under 60 seconds. No signup. No sales call. Just numbers.

Why We Built a Baltimore-Specific Calculator
Generic rental calculators — Zillow, BiggerPockets, Roofstock — are built for the national market. They use average tax rates, average vacancy, and average management fees. Baltimore is not average.
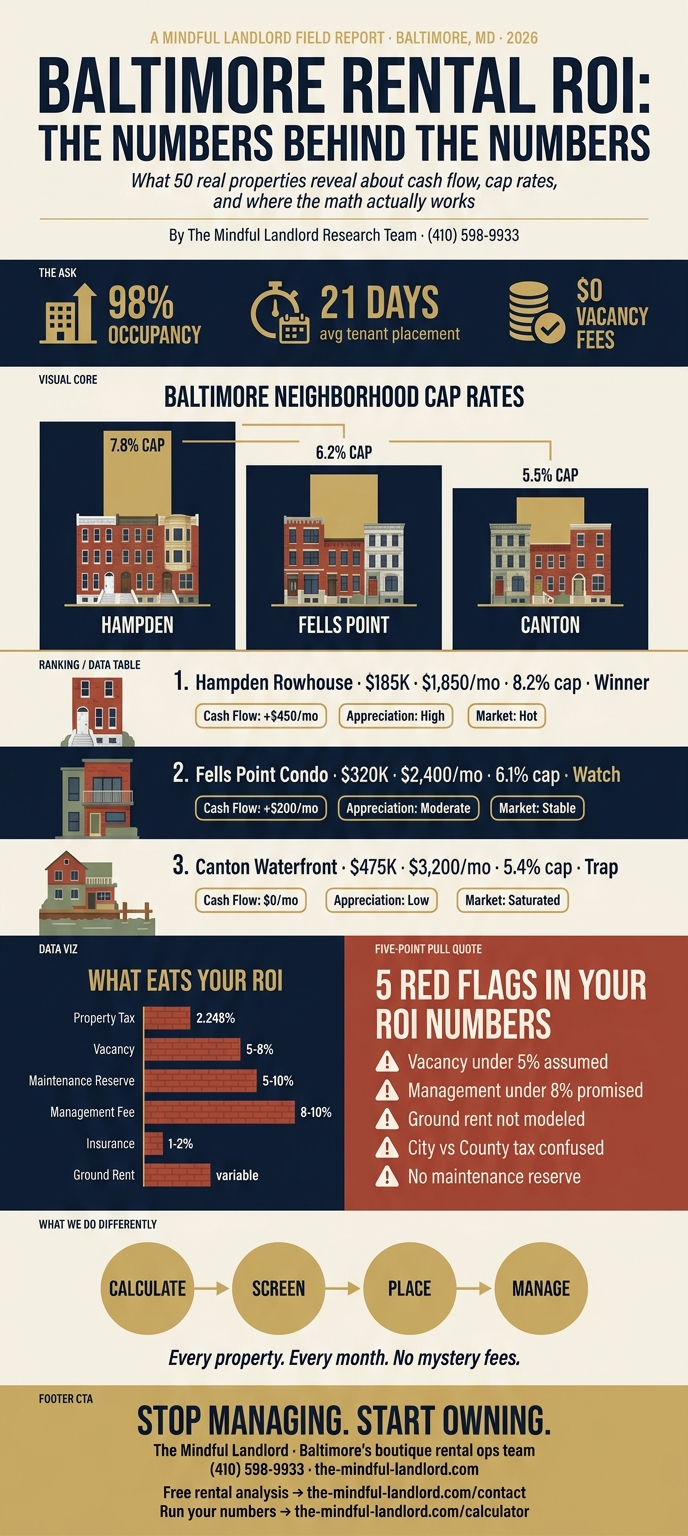
Baltimore City’s property tax rate is 2.248% — one of the highest in Maryland and roughly double Baltimore County’s rate. On a $250,000 rowhouse, that’s a $2,600-per-year difference compared to a calculator defaulting to 1.2%. That gap alone can flip a marginal deal from slightly positive to clearly negative.
Then there’s ground rent. Roughly 60,000 Baltimore City properties sit on leased land, carrying a fixed annual obligation ($50–$300) that most national calculators don’t even have a field for. Miss it and you’ve modeled a deal that doesn’t exist.
Baltimore’s Renters’ Rights and Stabilization Act (2024) also affects how you project rent increases over a 5-year hold. Properties that fall under stabilization provisions produce different 5-year curves than those that don’t.
We built this calculator because we needed it ourselves. When a landlord asks whether a Hampden rowhouse is a good deal, we run the same numbers you’ll see in the calculator — with every Baltimore-specific input already in place.
The 9 Inputs That Actually Matter in a Baltimore Rental Property ROI Calculator
Most investors obsess over purchase price. That’s table stakes. Here are the nine numbers that determine whether your Baltimore rental cash-flows — or bleeds quietly.
- Purchase price + rehab + closing costs: Your total all-in basis. Budget 5–8% of purchase price for closing costs and 10–20% for light-to-medium rehab on Baltimore’s pre-1970 rowhouse stock.
- After-Repair Value (ARV): The post-renovation market value. Run Baltimore comps within a quarter-mile — values can shift dramatically from block to block.
- Monthly rent: Use current market rent, not a previous tenant’s rate. Call us at (443) 378-9456 for a free rent estimate on any Baltimore address.
- Vacancy rate: Budget 6–8% for professionally managed properties. Our portfolio averages a 98% occupancy rate, but model 10–12% conservatively for your first year.
- Annual property tax: Pull the exact figure from SDAT. A $20,000 assessment error costs $450/year at Baltimore City’s rate — don’t estimate.
- Annual insurance: Landlord policies on Baltimore rowhouses run $900–$1,400/year. Don’t use homeowner insurance rates in your model.
- Management fee: Enter 8–10% if hiring a property manager. The Mindful Landlord charges 8–10% with no long-term contracts and $0 vacancy fees while we place your next tenant.
- Maintenance reserve: 5–10% of gross rent annually on a well-maintained property; 10–15% for pre-1940 stock with original mechanicals.
- Loan terms: Use your actual rate. Investment property loans run 0.5–0.75% above primary residence rates. Being off by half a point on a $200,000 loan is $800–$1,000/year in miscalculated carry cost.
Three Real Baltimore Properties Run Through the Baltimore Rental Property ROI Calculator
These are anonymized properties from our managed portfolio. Neighborhoods and numbers are real. Addresses are not.
Property A: Hampden rowhouse — cash flow winner
Purchase: $185,000. Rehab: $22,000. Total basis: $213,000. Monthly rent: $1,650. Property tax: $4,160/year. Insurance: $1,100. Management: 9%. Loan: 25% down, 7.2%, 30 years.
Calculator output: Annual Cash Flow $4,320 · Cash-on-Cash 7.7% · 5-Year Equity $68,400 · Net Cash Flow $360/mo
This is a working deal. The $360/month net isn’t lavish, but it clears costs with margin. The 5-year equity figure is where Hampden earns its reputation — steady mid-market appreciation in a neighborhood with strong rental demand from Hopkins-area renters and young professionals.
Property B: Fells Point condo — the appreciation bet
Purchase: $310,000. HOA: $285/month. Monthly rent: $2,100. Property tax: $6,970/year. Management: 9%.
Calculator output: Annual Cash Flow -$1,440 · Cash-on-Cash -2.1% · 5-Year Equity $94,000 · Net Cash Flow -$120/mo
Negative cash flow isn’t automatically fatal — if the appreciation thesis holds. Fells Point condos have appreciated 4–6% annually over the past decade. But you’re writing a $120/month check every month banking on that. If the HOA raises dues (which Fells Point HOAs have done repeatedly), you’re deeper underwater. Know what you’re buying before you buy it.
Property C: Canton waterfront — the low-cap-rate trap
Purchase: $475,000. Monthly rent: $2,800. Property tax: $10,680/year.
Calculator output: Annual Cash Flow -$3,600 · Cash-on-Cash -3.2% · Cap Rate 3.8% · Net Cash Flow -$300/mo
A 3.8% cap rate against 7%+ mortgage rates means you’re losing ground from day one. The rent ceiling in Canton doesn’t scale with the purchase premium. This is a personal real estate bet, not a rental property. The calculator makes that distinction before you sign — not after.
Run your own numbers in 60 seconds.
Every property above ran through the same calculator you can open right now — Baltimore-specific inputs, no signup required.
→ Open the Free Rental Performance Calculator5 Patterns From the First 50 Baltimore Properties We Analyzed
Our managed portfolio spans 50+ properties across Baltimore City and County. Here’s what the data shows.
- Hampden and Remington consistently outperform Canton on cap rate. Mid-market neighborhoods in the $150,000–$250,000 range hit 6.5–8.5% cap rates. Canton and Fells Point rarely clear 5%. The premium neighborhoods’ rent ceilings don’t scale with their price premiums.
- 75% LTV refinances outperform 80% LTV on cash-on-cash after rate reset. The 5% LTV difference typically shows up as $80–$120/month of additional net cash flow when you refi. That compounds over a 5-year hold.
- Vacancy assumptions under 5% almost always lie. Even with our 21-day tenant placement guarantee, most investors underestimate turnover costs: cleaning, minor repairs, and the days between tenants. Model 6–8% unless you have years of real data on that specific property.
- Management fees under 8% usually mean hidden fees elsewhere. Watch for lease-up fees, maintenance markups, and inspection charges that aren’t in the headline rate. TML’s structure is 8–10% all-in — no surprise line items.
- The best deals clear $400+/month net after PITI. That buffer absorbs a surprise repair or a shorter vacancy without turning your rental into a liability. Deals under $200/month net leave too little margin for Baltimore’s older housing stock.
What the Calculator Can’t Tell You
Numbers don’t capture everything. Here are three things the calculator flags as risks but can’t fully quantify.
Block-level variance in Baltimore
Baltimore’s rental market operates at the block level, not the neighborhood level. Two rowhouses on the same street can have a $300/month rent differential based on school zone boundaries, proximity to transit, and the condition of adjacent properties. Our local knowledge fills that gap — the calculator gives you the framework; we give you the market read.
Deferred maintenance on pre-1940 stock
Baltimore’s rowhouse inventory is old. A property that looks clean can have knob-and-tube wiring, lead paint, or a failing chimney that a standard inspection misses. We budget 10–15% maintenance reserve on anything pre-1950 until we have two years of expense history on the property.
Tenant quality multiplier
A good tenant in a B-class property outperforms a bad tenant in an A-class property every time. Our 21-day placement guarantee is backed by a screening process that checks credit, income, rental history, and criminal background — because the best calculator in the world can’t compensate for an eviction.
How to Use the Baltimore Rental ROI Calculator for BRRRR Analysis
The calculator is built around the BRRRR method (Buy, Rehab, Rent, Refinance, Repeat). Here’s the workflow:
- Enter your purchase price, rehab budget, and closing costs to establish your all-in basis.
- Enter the After-Repair Value (ARV) after renovation is complete.
- Set the refi LTV (typically 70–75% for investment property cash-out refis) and your projected interest rate.
- The calculator shows your cash left in the deal after the refi — ideally $0 or close to it on a clean BRRRR.
- Enter rent, vacancy, taxes, insurance, management, and maintenance to see your net cash flow on a fully recycled capital stack.
The cash-on-cash return on a clean BRRRR — where you pull all your capital out — is technically infinite (no cash left in the deal). The calculator handles this edge case and shows it clearly.
Ready to run your Baltimore BRRRR?
No signup. No sales call. Baltimore-specific inputs built in.
→ Open the Free Rental Performance CalculatorFrequently Asked Questions
Is the Baltimore rental ROI calculator really free?
Yes. No email required, no account, no trial. Open it, run your numbers, download a PDF report if you want one. That’s it.
How accurate is the calculator?
The calculator is as accurate as your inputs. Garbage in, garbage out — which is why we document every input field. The tax and insurance defaults are calibrated to Baltimore City and County averages from our managed portfolio. Replace them with your actual numbers for the property in question.
Does it handle the BRRRR method?
Yes. Enter your purchase price, rehab, ARV, and refi terms. The calculator shows your cash left in the deal, your cash-on-cash return on recycled capital, and your 5-year equity and cash flow curves.
What if I want a human to run the numbers with me?
Call (443) 378-9456 or schedule a free rental analysis. We’ll run your specific property through the same model and give you a market rent estimate, vacancy forecast, and management cost breakdown — no charge, no obligation.
Does it work for multi-family?
The current version is optimized for single-family and small multifamily (2–4 units). Enter combined rent for all units and combined operating costs. A dedicated multifamily module is on the roadmap.